As we move further into 2025, dealmakers continue to navigate an evolving economic and political landscape. In our March 2025 M&A trend update, we noted that heightened uncertainty surrounding the presidential election had a greater-than-anticipated dampening effect on the economy in Q4 2024. With Q1 2025 data now available, how has the deal environment evolved since then?
This article provides a summary of key information from the DealStats Value Index for Q1 2025, with a focus on private companies.
M&A Trends for Q1 2025
From Q4 2024 to Q1 2025, market data reflects a cautious but slightly improving deal environment following the election-driven uncertainty in late 2024. While EBITDA multiples did continue to rebound in Q1 2025 from the sharp decline seen in Q3 2024, the recovery was less robust than expected due to concerns over tariffs and global trade tensions. The median selling price per earnings before interest, taxes, depreciation, and amortization (EBITDA) across all industries fluctuated throughout the year: 4.3x at Q1 2024, 4.8x at Q2 2024, 3.2x at Q3 2024, 3.5x at Q4 2024, and 3.7x at Q1 2025.
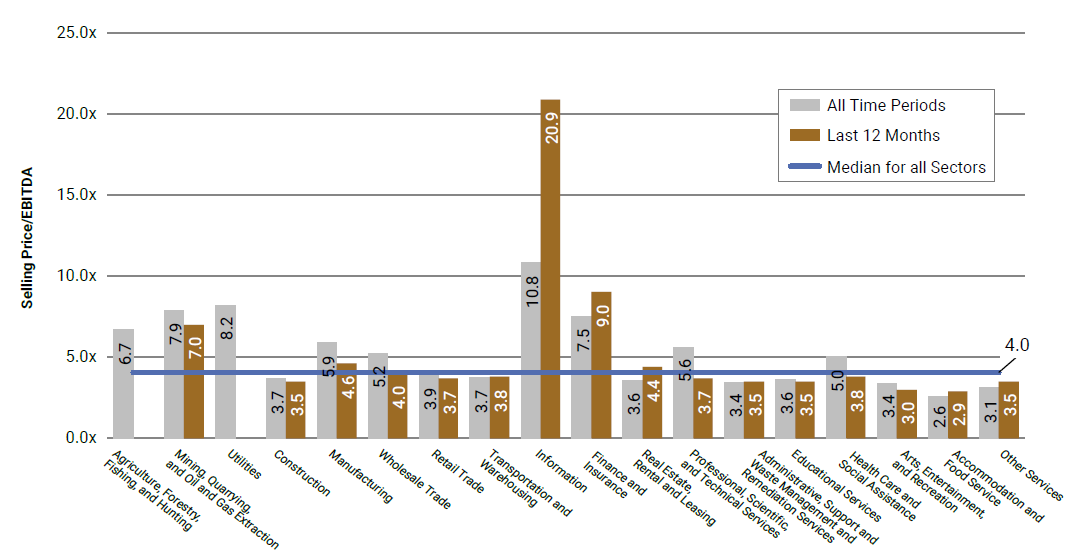
EBITDA multiples continued to vary significantly by industry. Over the past twelve months, the information sector yielded the highest selling price for EBITDA at 20.9x, followed by finance and insurance at 9.0x. For the last twelve months, the accommodation and food service sector yielded the lowest selling price for EBITDA at 2.9x, with arts, entertainment and recreation yielding a selling price for EBITDA at 3.0x.
The table below illustrates the median selling price per EBITDA by industry for private companies:

Median selling price per net sales for private companies illustrated a significant increase from previous quarters yielding a multiple 0.7x at Q4 2024. However, this increase was followed by a decrease to 0.6x as of Q1 2025.
The table below illustrates the median selling price per net sales for private companies:

Median net sales multiples for private companies decreased in five of the 15 industry sectors in 2024. The information and education sectors saw notable decreases of 19% and 23%, respectively. In addition, the insurance sector yielded a significant increase of 52%.
The following table illustrates the median selling price per net sales by sector for private companies:

Median EBITDA multiples saw a positive increase in 11 of the 15 sectors in 2024. Notable increases occurred in transportation and warehousing, and real estate and rental and leasing, with increases of 27% and 24%, respectively.
The following table illustrates the median selling price per EBITDA by sector for private companies:

What Does This Mean for Your Business?
Understanding current M&A valuation multiples—especially within your industry—can help you assess market positioning and prepare for a transaction. Whether you’re considering a sale, seeking investment, or simply benchmarking performance, now is a good time to evaluate how your business aligns with these trends.
Have questions or want to explore your options? Contact us to discuss how these insights may impact your valuation and transaction strategy or click here to learn more about our M&A Transaction/Advisory Services.

