

The wholesale distribution industry in the U.S. includes approximately 400,000 establishments (single-location companies and units of multi-location companies) with combined annual sales of about $8 trillion. With that large a group, it is easy to find good benchmarking data you can use to compare your company’s performance against the rest of the industry. Here are three recently published key performance indicators for your consideration.
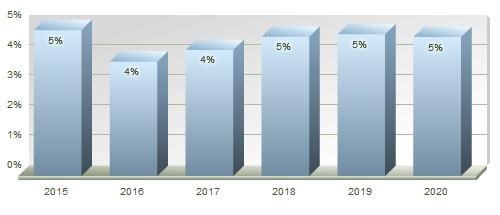
1.Revenue Forecast: Revenue for the U.S. wholesale industry is expected to grow at an annual compound rate of five percent between 2016 and 2020.
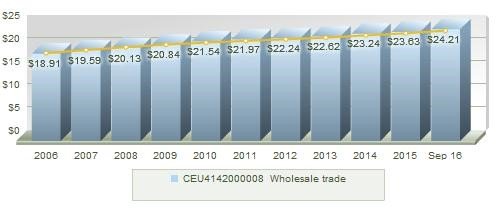
2.Historical Hourly Wages: Average hourly rates have continued to increase over the past ten years.
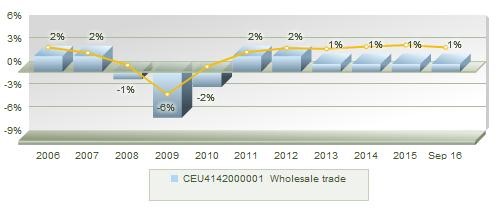
3.Historical Employment Growth: Despite average hourly wage increases, the employment growth rate has remained relatively low.
In addition to these tangible statistics, we recently solicited insights from our relationships in the distribution industry about the trends they’re seeing and what is currently keeping them up at night. Here are the common themes:
- Inventory Carrying Costs: Many distributors finance their inventories, and since inventory financing is often tied to the variable prime lending rate, they are sensitive to interest rate fluctuations. Inventories are typically larger for industrial equipment distributors, while smaller for distributors of food and petroleum products. Because industry profit margins are low, financing costs have a large impact on profits.
- Sensitivity to Energy Prices: Distributors that operate delivery fleets are sensitive to changing energy costs. Most vulnerable are distributors that make multiple deliveries per day to many customers, such as supermarkets or car repair shops. Diesel fuel prices rose 80 percent between 2004 and 2013, but have declined significantly since then. Where prices will go over the next few years, though, is anyone’s guess.
- Industry Consolidation: Some industry segments have experienced a wave of consolidation. This is due to an increase in customers who need regional or nationwide service and the greater purchasing power and transportation economies that large operations can produce.
- International Suppliers: Low international freight costs and prices for some foreign goods have encouraged distributors to buy a greater volume of goods from foreign manufacturers. U.S. imports dropped to abnormally low levels in 2009 due to the global economic slowdown, but between 2006 and 2011 total U.S. imports of manufactured goods increased about 15 percent. Imports from China increased 35 percent. More recently, import levels have started to normalize. Large distributors may have buying offices in Hong Kong or other foreign cities; smaller distributors buy through sales offices that foreign companies have set up in the U.S.
With the annual planning and budgeting season at its peak, now is a great time to consider how your distribution company compares to these benchmarks and trends, and make plans to course correct if necessary.
Robert S. Olszewski can be reached at Email or 215.441.4600.

You may also like: